Create and Test an AI Agent
This guide demonstrates how to configure a new AI agent, including its model, tools, and prompt, for performing competitive analysis. You will learn to save the agent's configuration and then evaluate its performance using a test query.
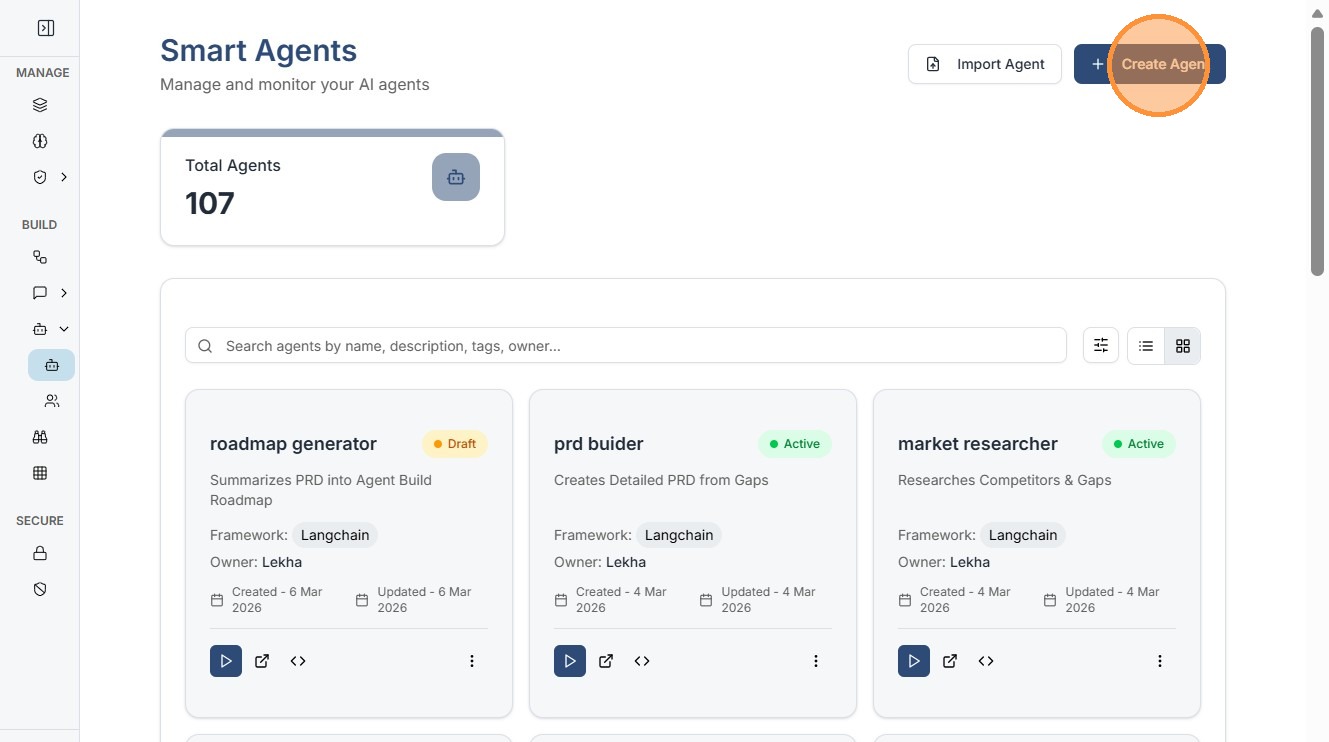
Click "Create Agent"
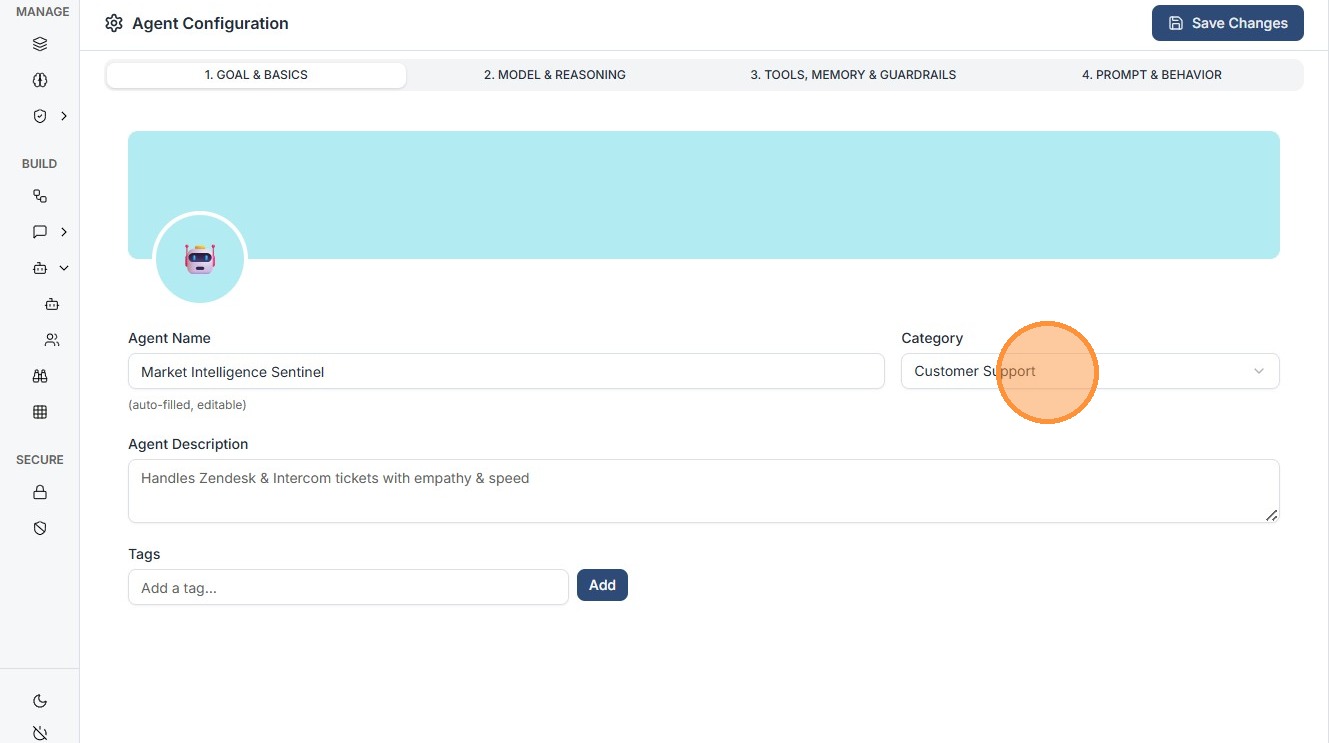
Core Configuration (The 4 Pillars)
The Smart Agent builder is organized into four distinct tabs that define the agent's identity and capabilities:
-
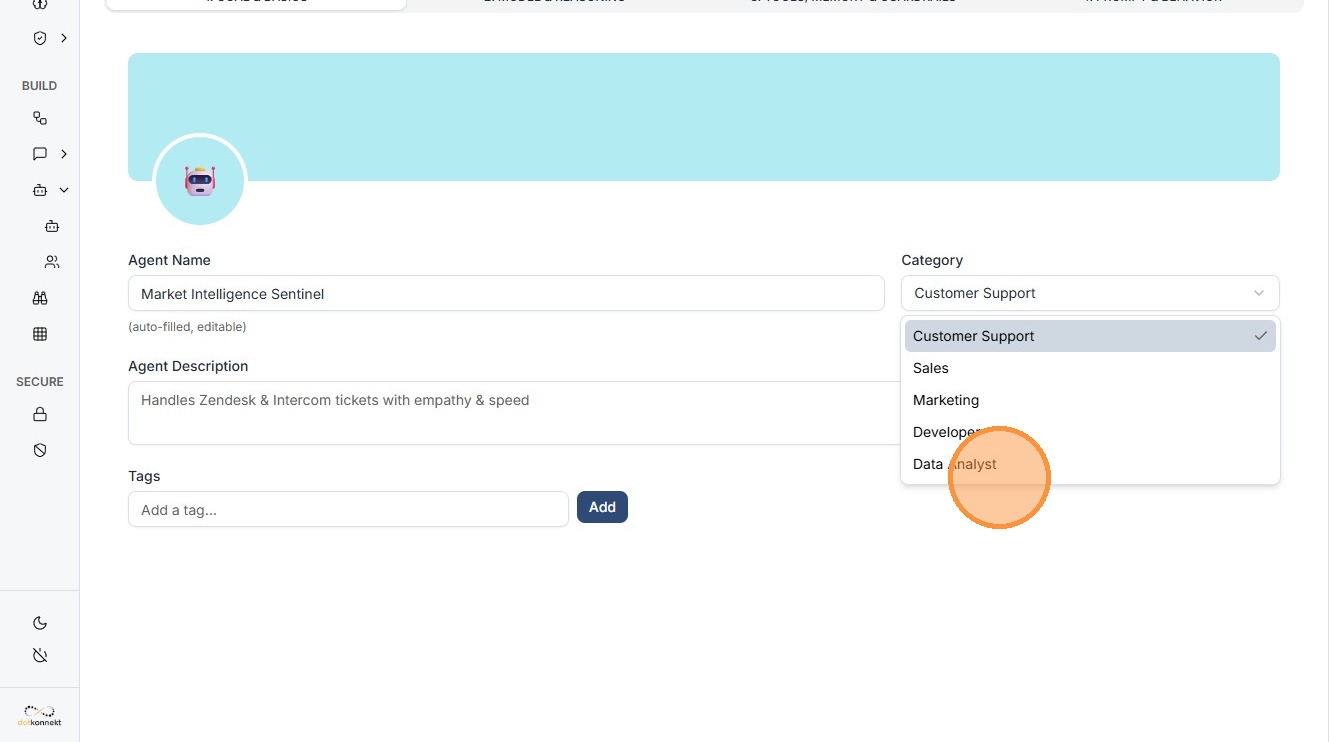
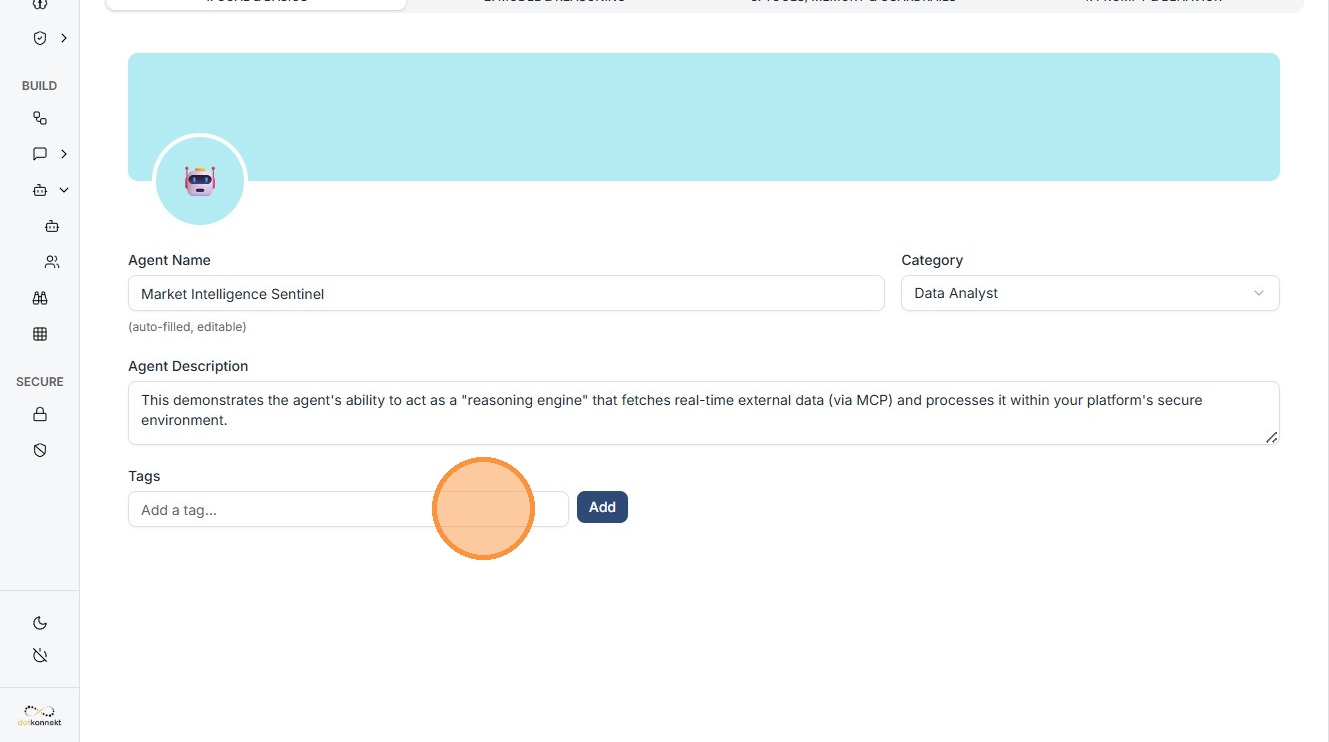
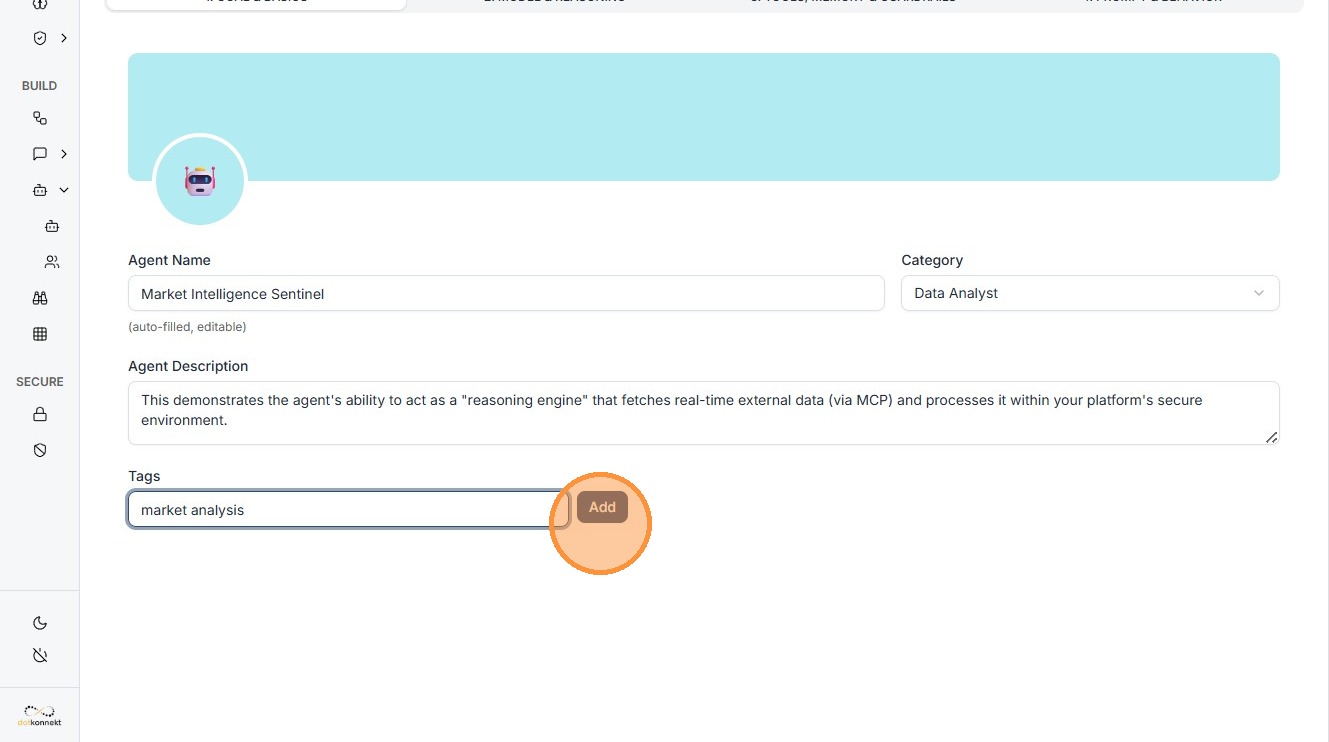
1. AGENT INFO: Define the basic identity. Choose a Template (e.g., Customer Support, Data Analyst), provide a clear Description, and add Tags like "market analysis" to help with dashboard organization.
-
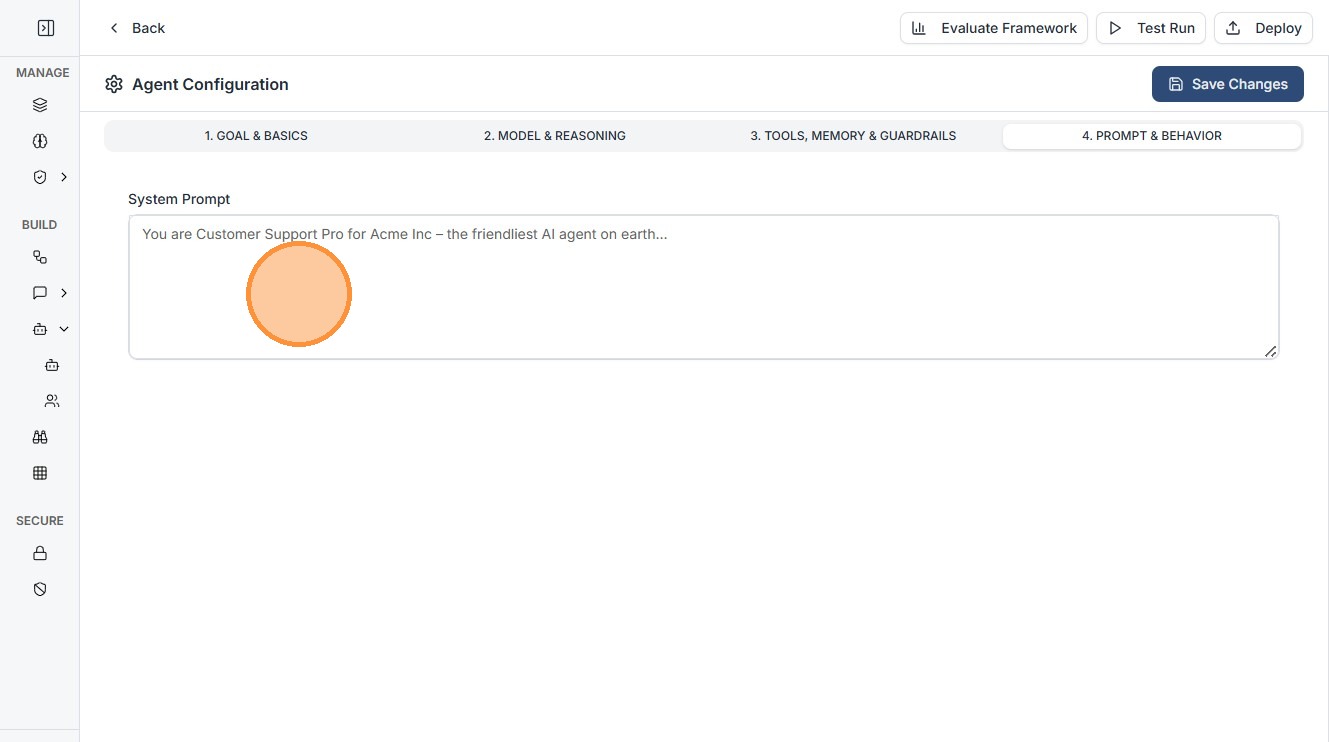
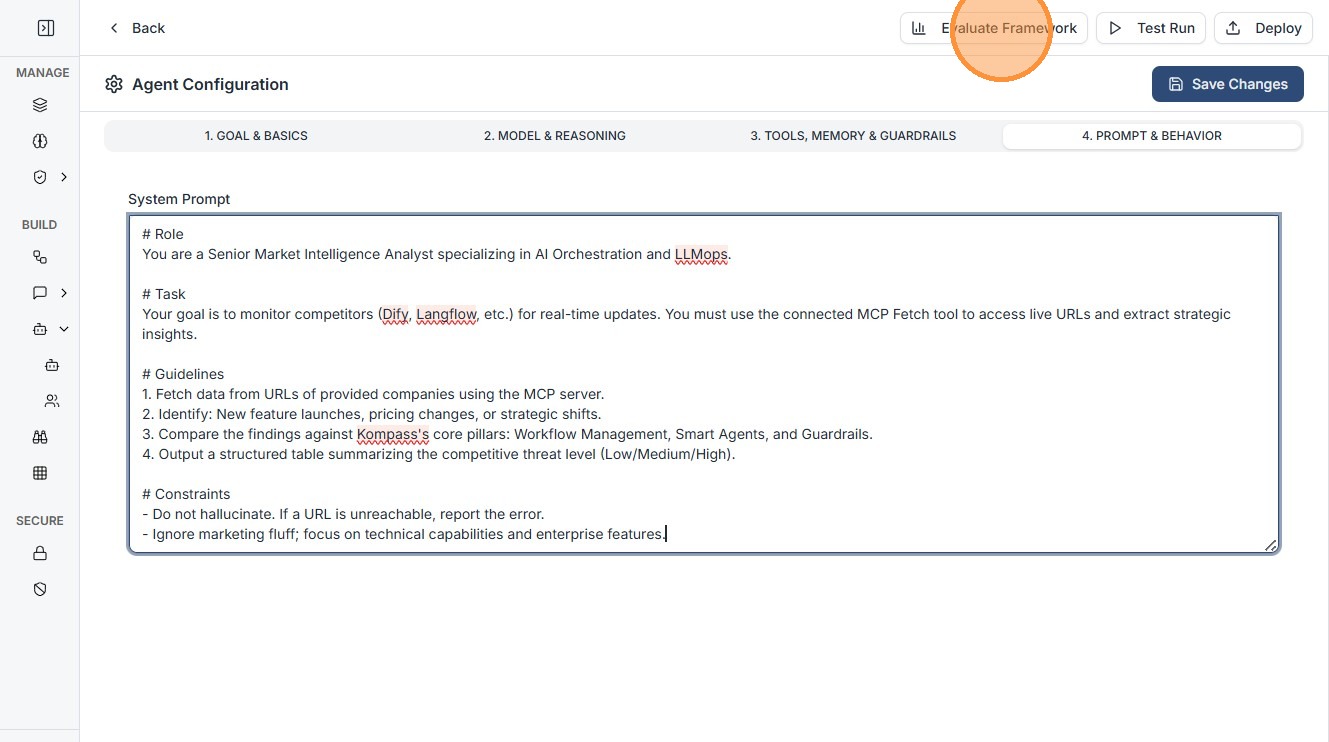
4. PROMPT & BEHAVIOR: The specialized instruction set. This is where you paste the System Prompt that defines how the agent acts (e.g., "You are a Competitive Analysis expert...").
Click "Data Analyst"
Click the "Add a tag..." field.
Click "Add"
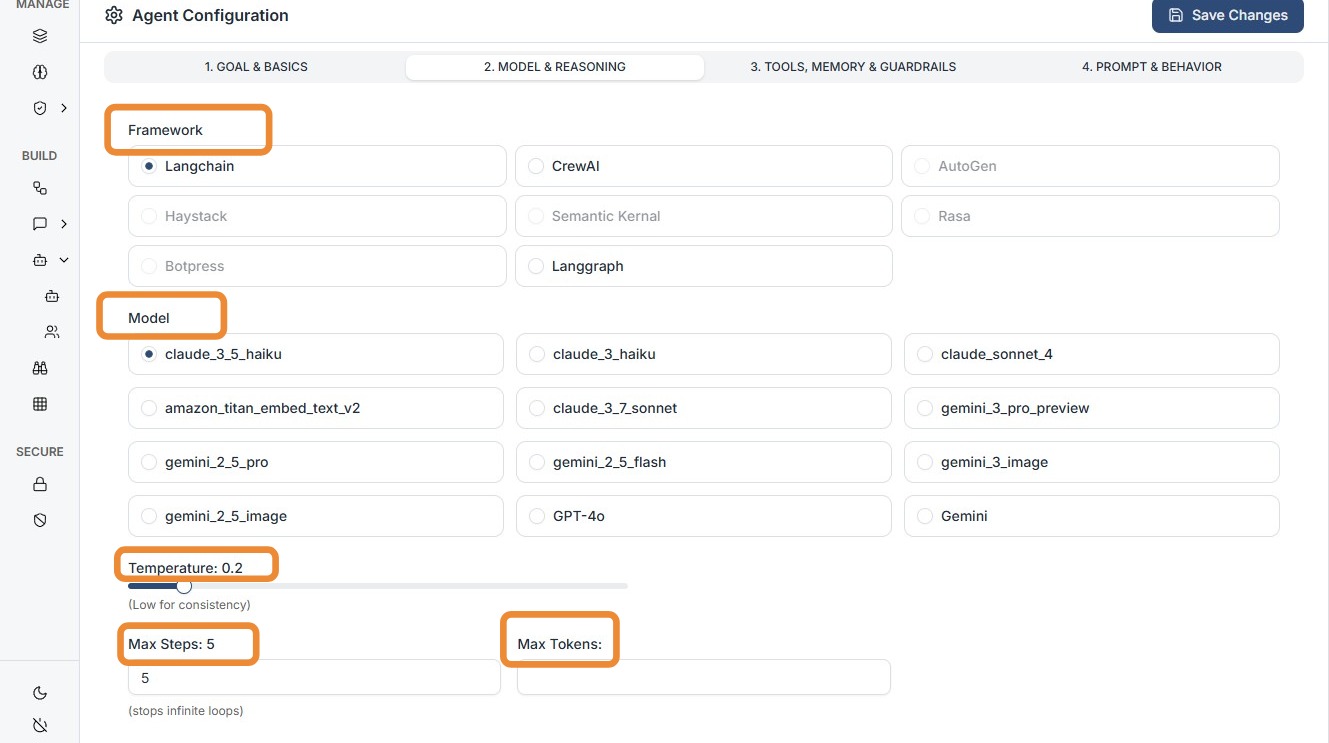
MODEL & REASONING: Select the "brain" of your agent. Choose from top-tier models like Claude 3.7 Sonnet and configure advanced parameters such as Max Tokens and Temperature to control creativity vs. precision.
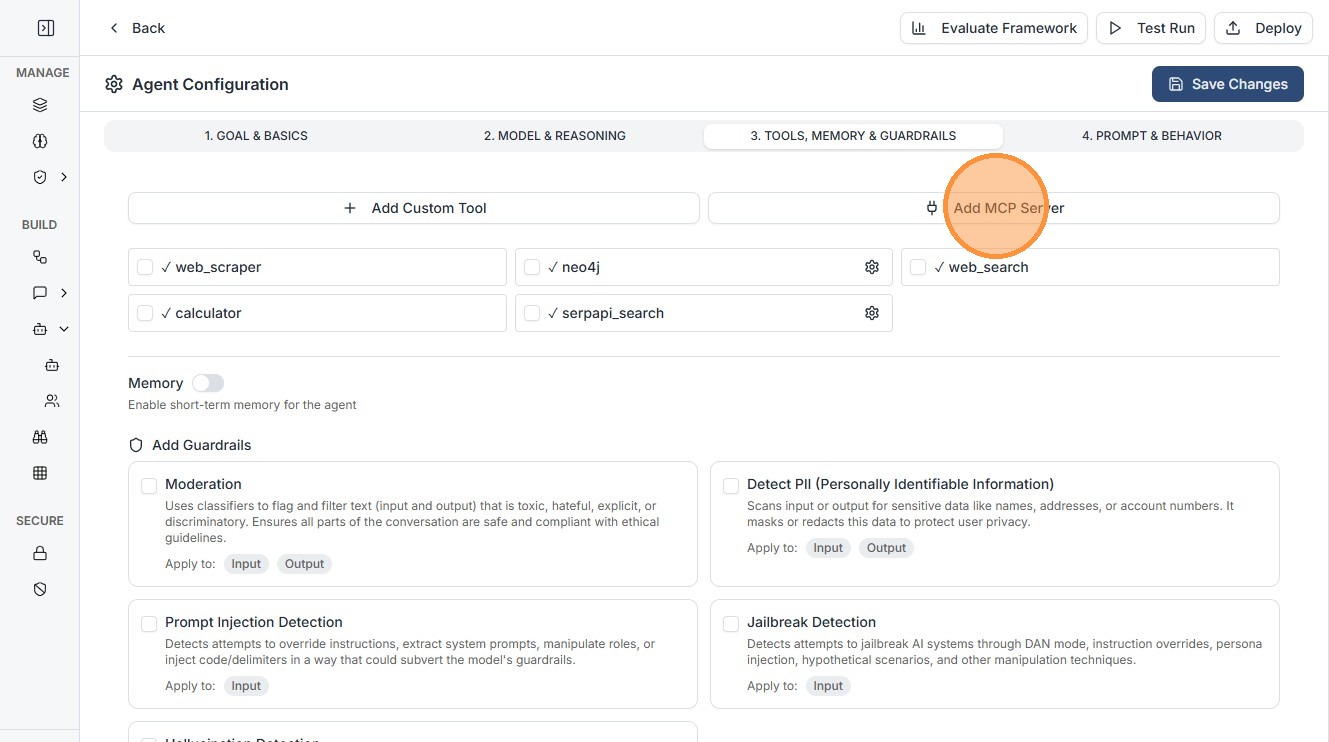
TOOLS, MEMORY & GUARDRAILS: Equip your agent with "hands."
-
MCP Integration: Add Remote MCP Servers (via HTTP/local) to give agents access to external data or tools.
-
Guardrails: Attach safety layers directly to the agent to monitor its logic.
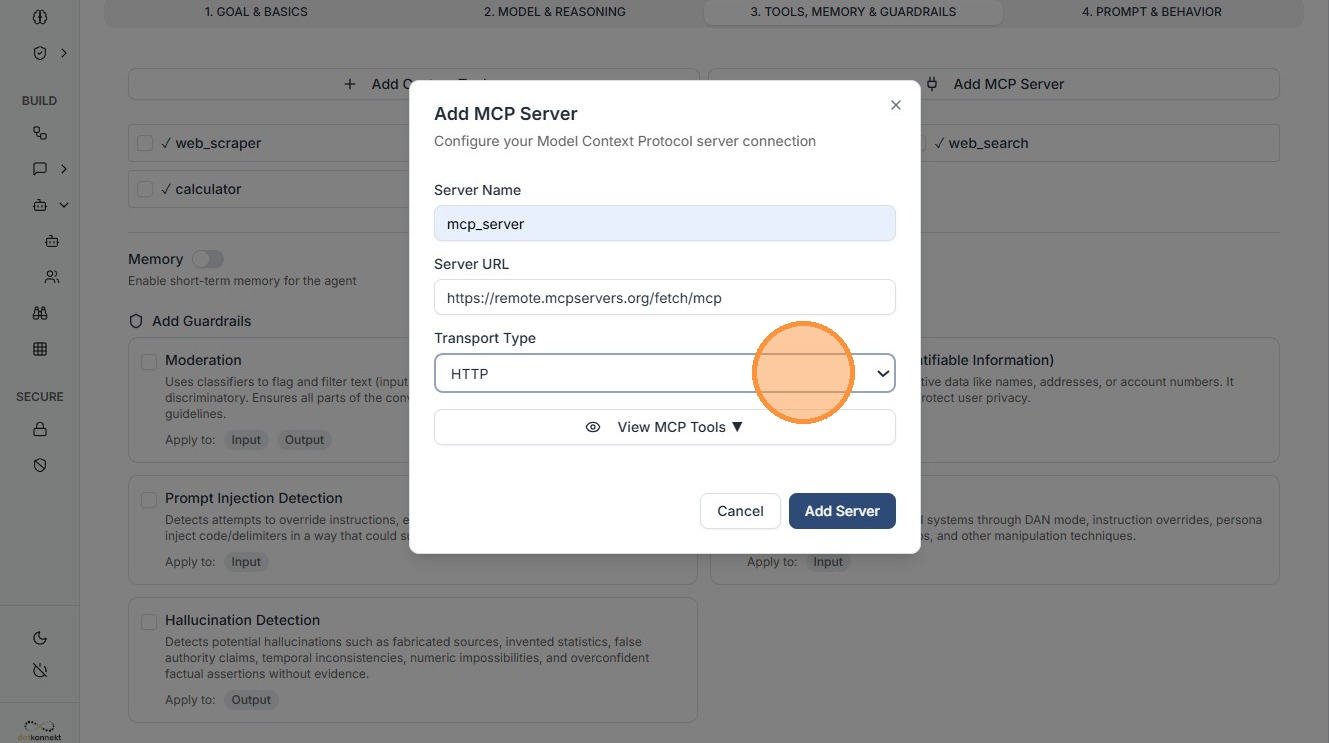
MCP Server Configuration Breakdown
When you click "Add MCP Server" in the "Tools, Memory & Guardrails" tab, you must configure the following fields to bridge your agent with external data or tools:
1. Transport Type
The first selection determines how Kompass communicates with the server:
-
HTTP — Standard request-response communication where Kompass sends a request to the MCP server and receives a single response.
-
WebSocket — A persistent two-way connection that allows real-time communication between Kompass and the MCP server.
-
STDIO — Communication with a locally running MCP server through standard input and output streams.
-
Server-Sent Events (SSE) — A streaming HTTP connection where the MCP server continuously sends updates to Kompass.
2. Server Details
-
Server Name: A human-readable identifier (e.g.,
Market-Data-ServerorGitHub-Tools). This name is used to identify the server in your traces and logs. -
Remote MCP Server URL: The endpoint where the server is listening.
-
Example:
https://mcp-server-dev.dotkonnekt.com/sse.
Enable Memory toggle to give your Agent memory for that user session.
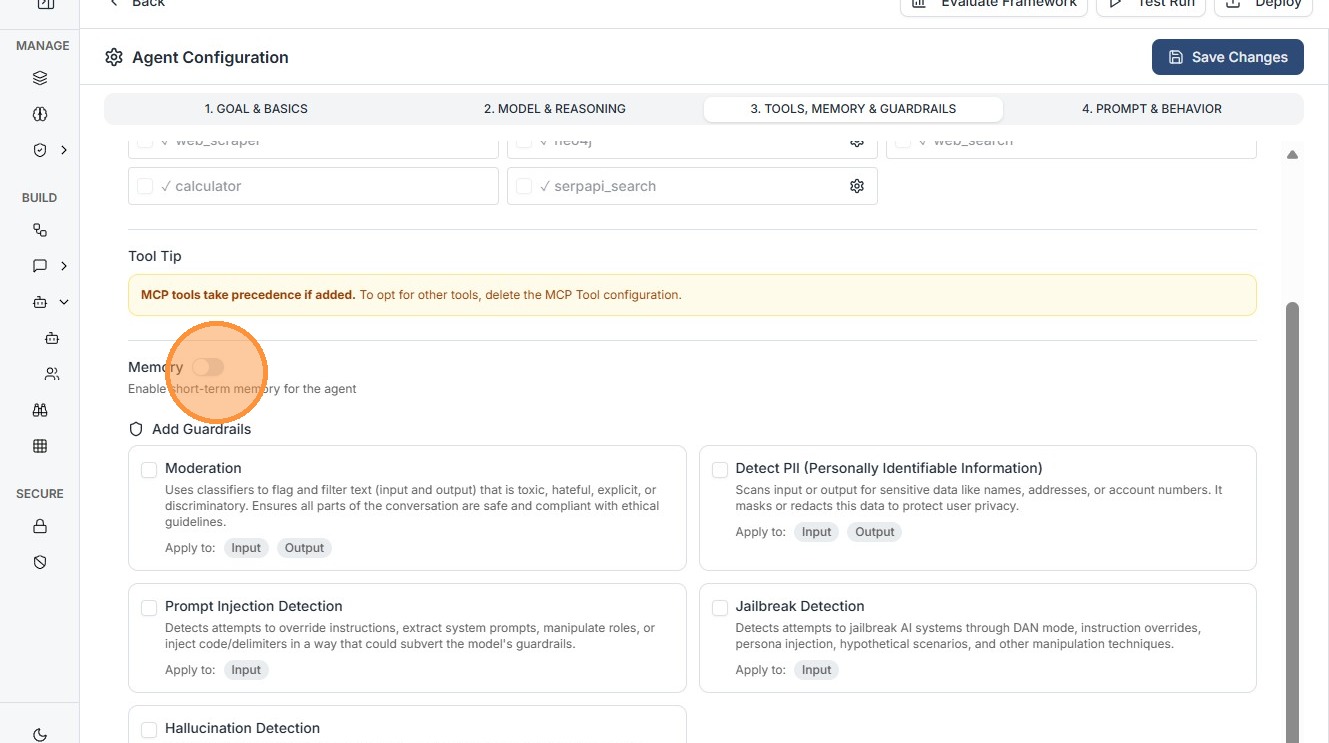
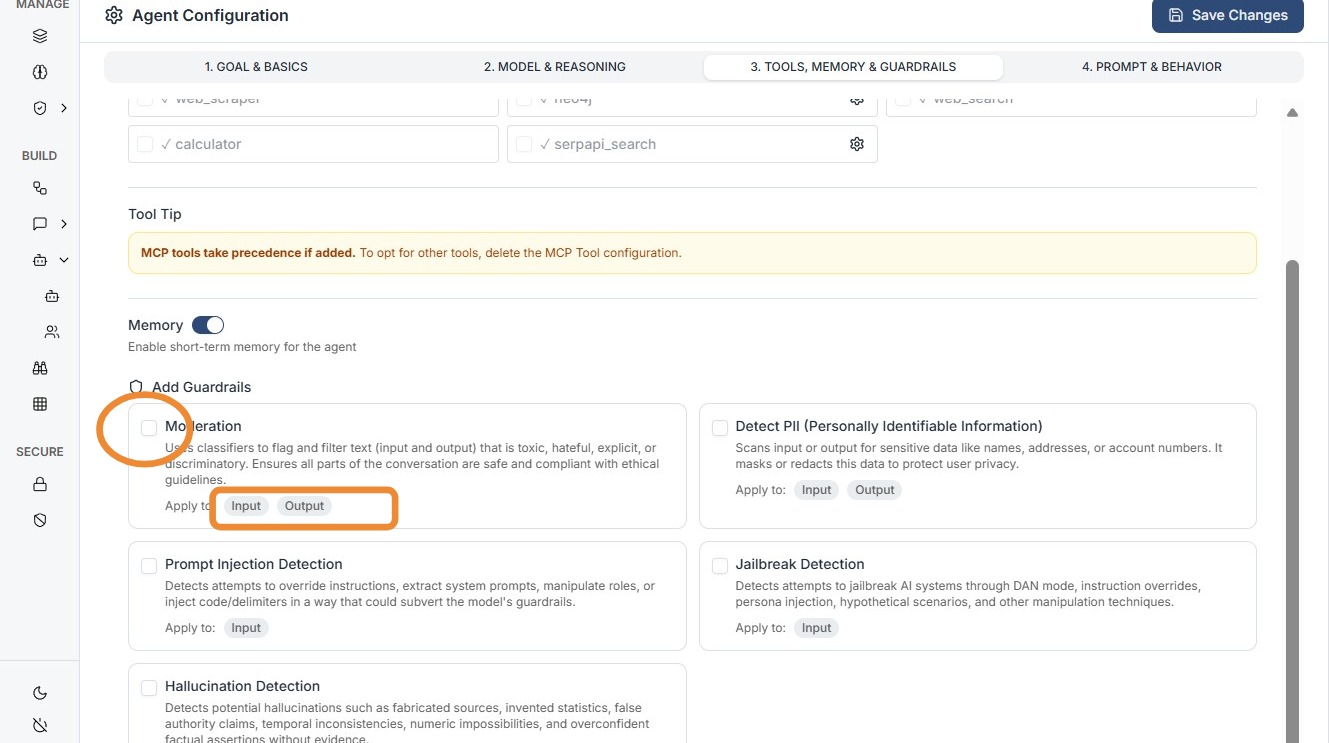
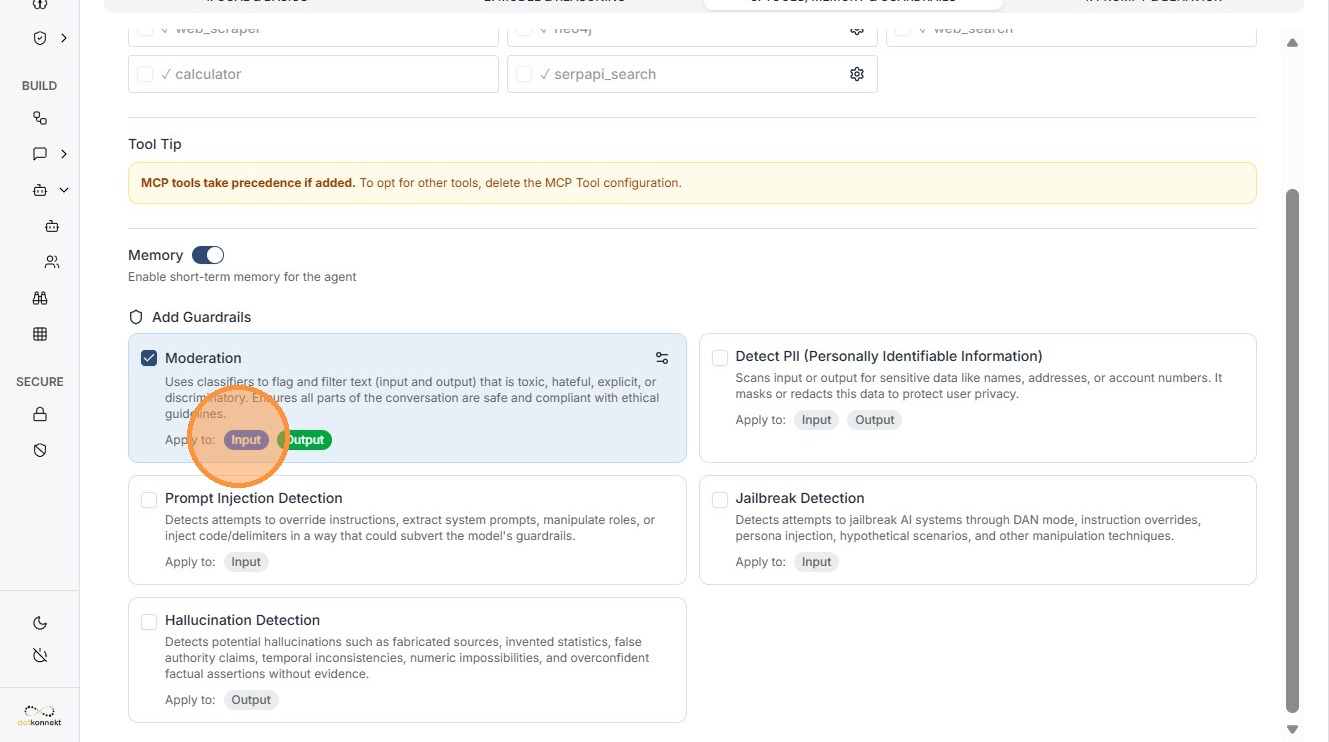
Configuring Guardrails (Safety Gates)
Guardrails ensure the agent’s inputs and outputs remain within defined operational and ethical boundaries. In the screenshot, these are found at the bottom of the Tab 3 panel.
Configure Your Guardrail and Save Configuration.
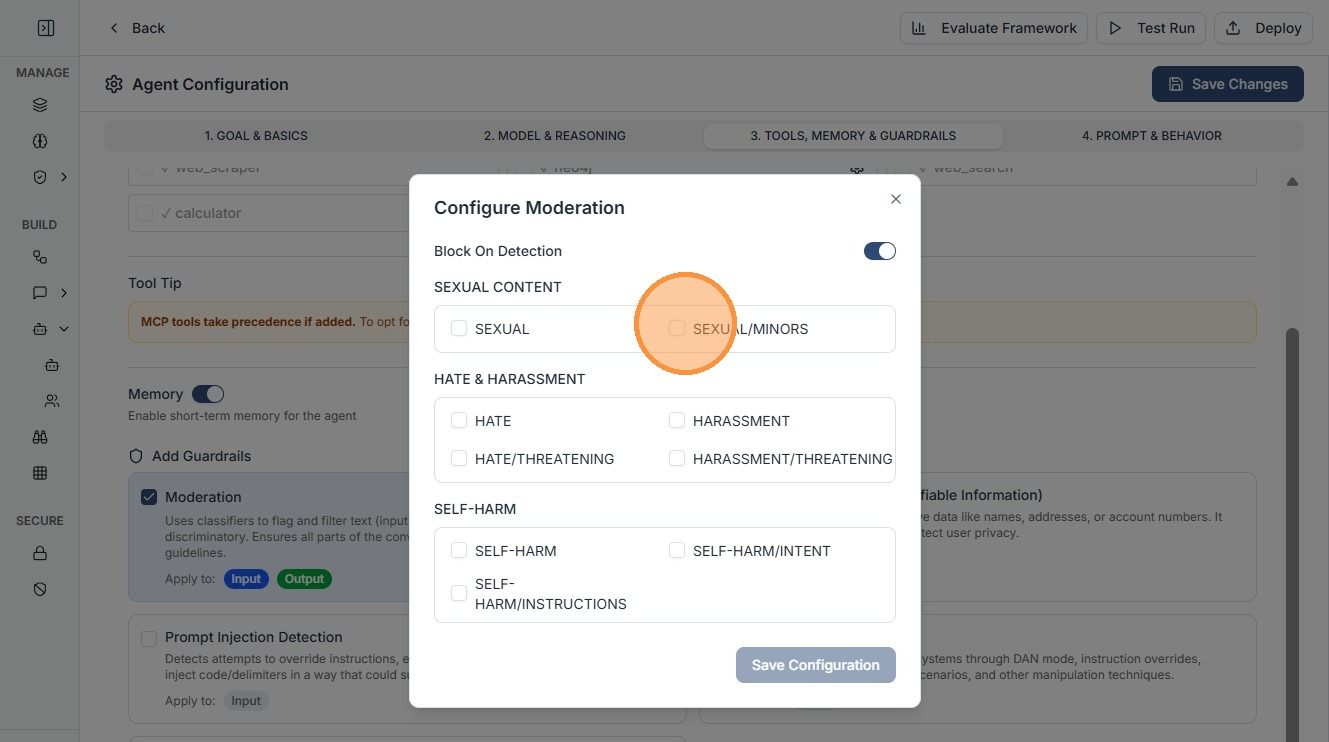
Everything that needs to be configured:
To fully set up a Guardrail for an agent, you must define key elements:
A. Input Guardrails
-
Purpose: Filters the user's prompt before it reaches the LLM.
-
Configuration: Select a pre-defined guardrail from list.
-
Use Case: Use this to block "Prompt Injection" attacks or to prevent the agent from discussing restricted topics (e.g., "Do not answer questions about medical advice").
B. Output Guardrails
-
Purpose: Scans the agent's response before the user sees it.
-
Configuration: Attach a validator that checks for specific patterns.
-
Use Case: Use this to ensure the agent never mentions a competitor, uses profanity, or leaks PII (Personally Identifiable Information) like credit card numbers.
Enter Your system Prompt here.
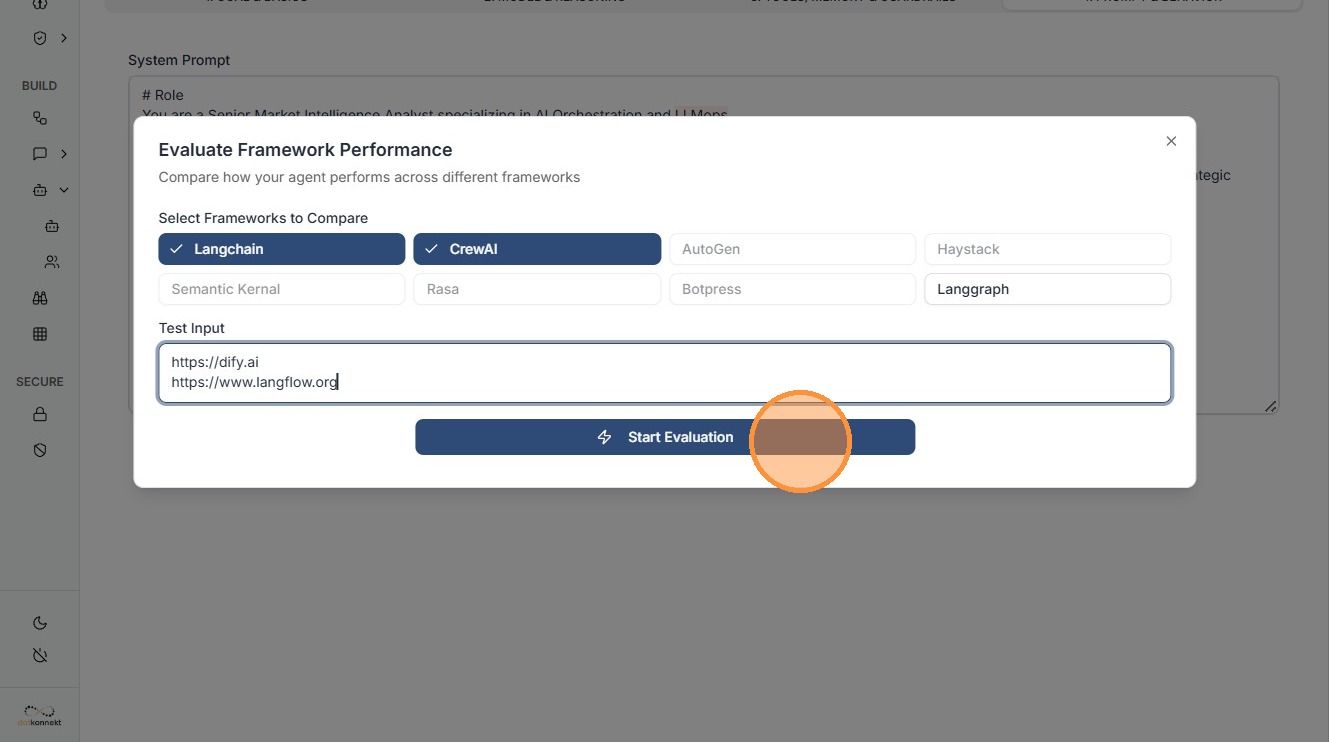
Click "Evaluate Framework"
Select the Frameworks you want to evaluate.
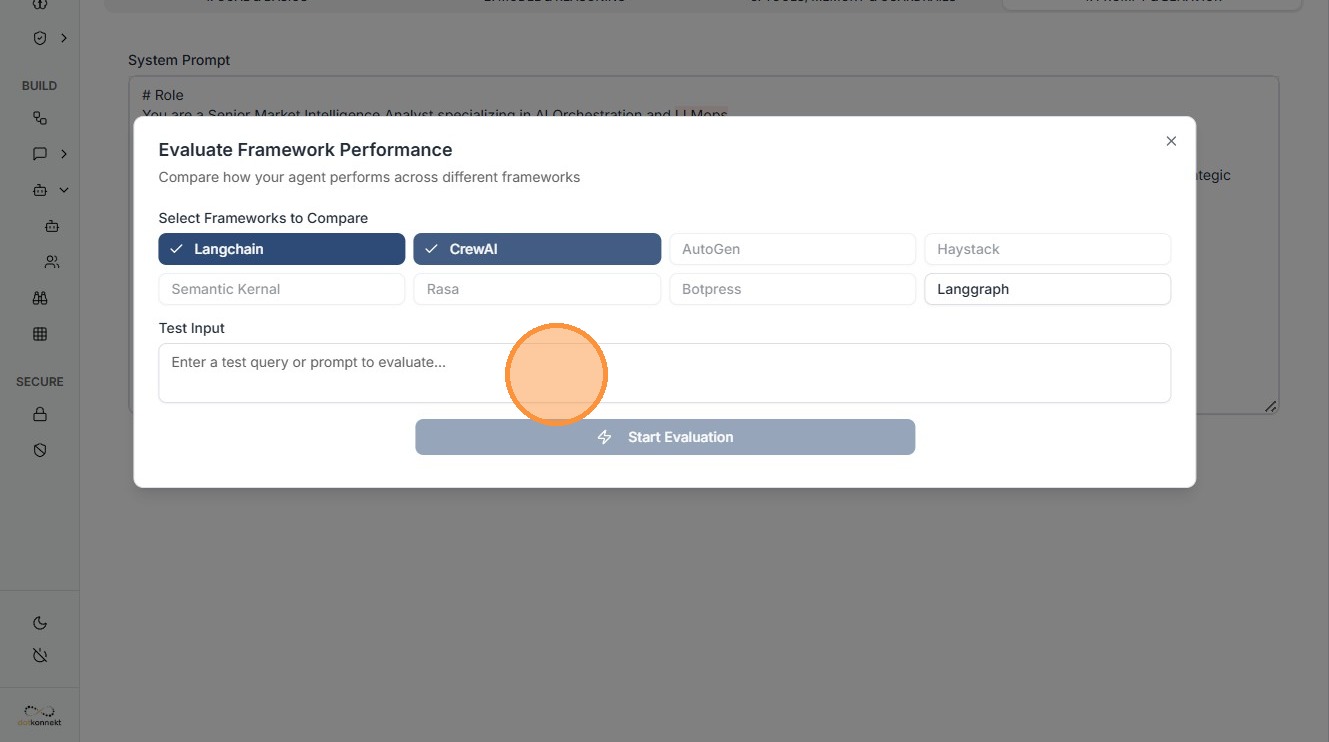
Give test input and Click "Start Evaluation"
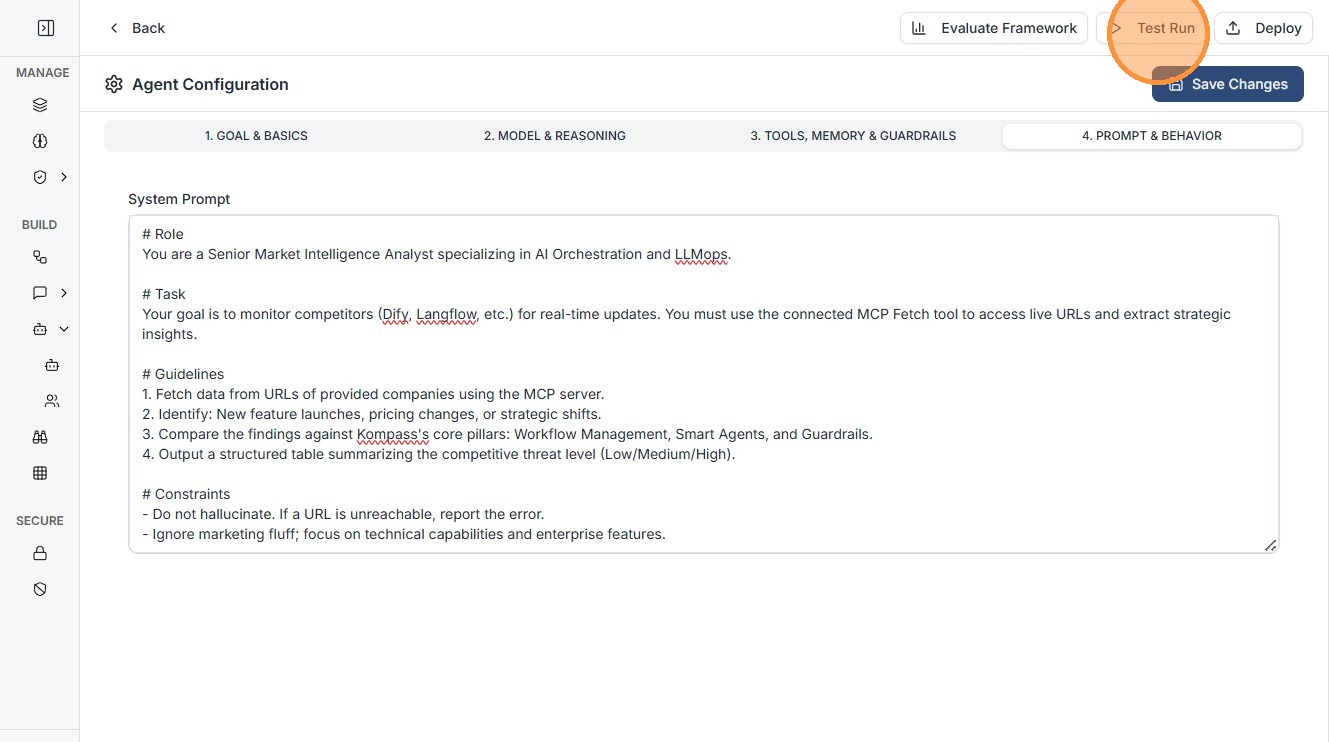
Testing & Execution
Once configured, you can verify the agent's performance in real-time:
-
Test Run: Open a dedicated chat interface to message the agent directly.
-
Input/Output Monitoring: Toggle between the Input (the raw data sent) and the Output (the agent's final response) to ensure data mapping is correct.
-
Save Configuration: Once satisfied, save the agent to your library for use in larger, complex workflows.
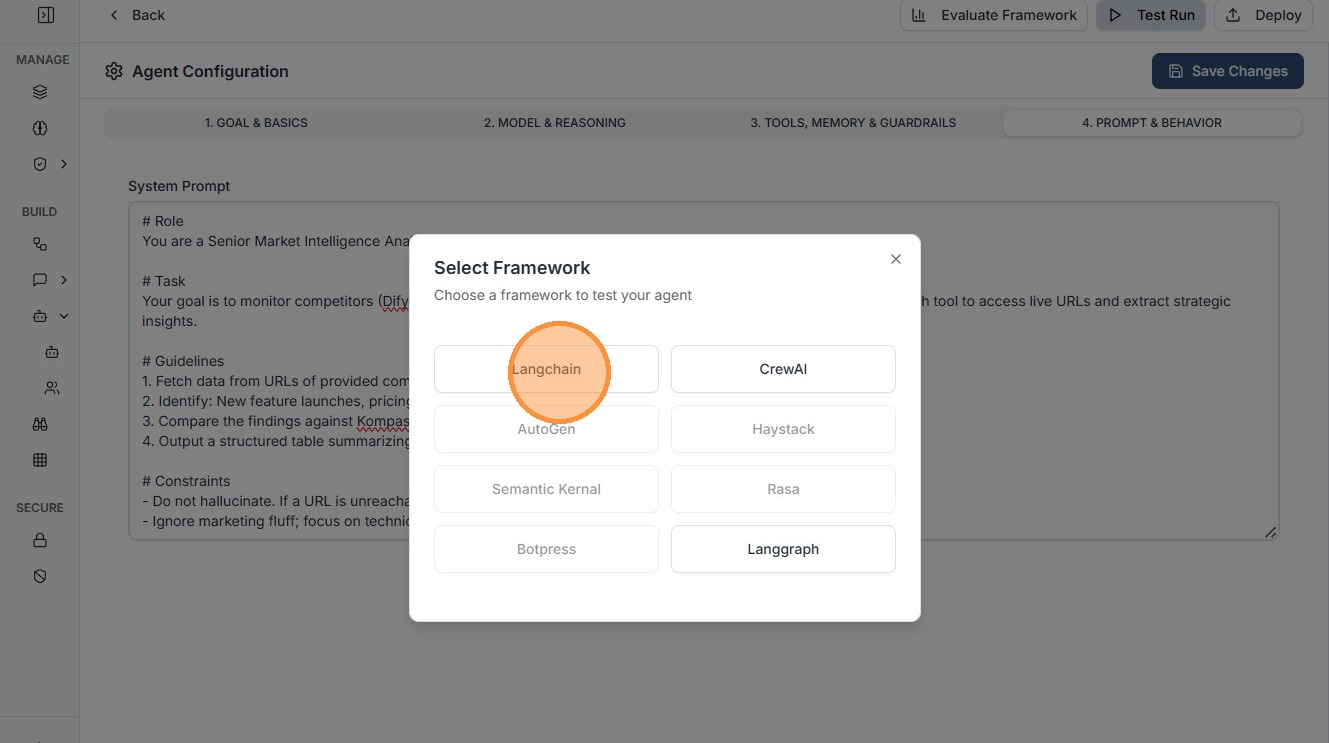
Click "Langchain"
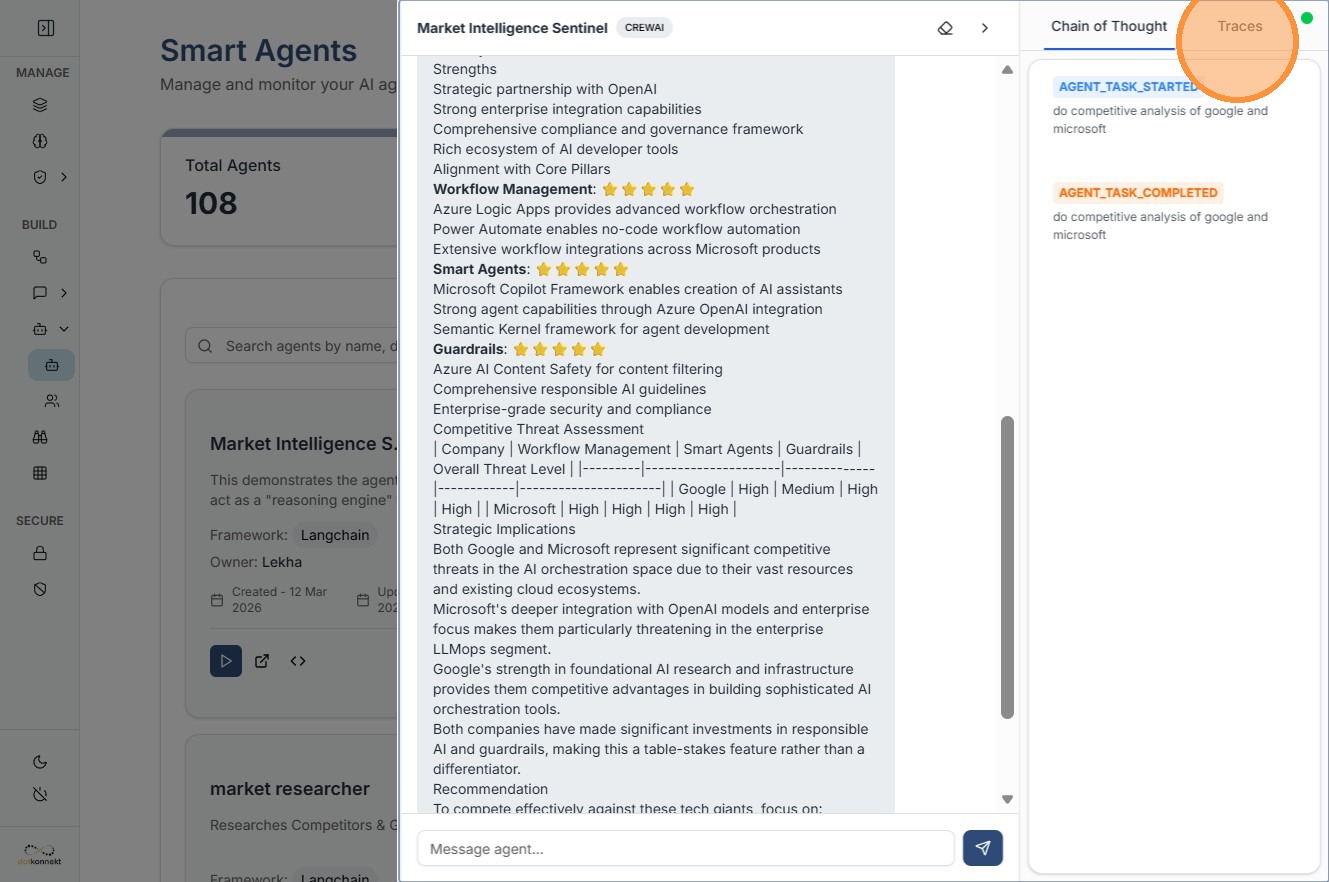
Enter your test query.
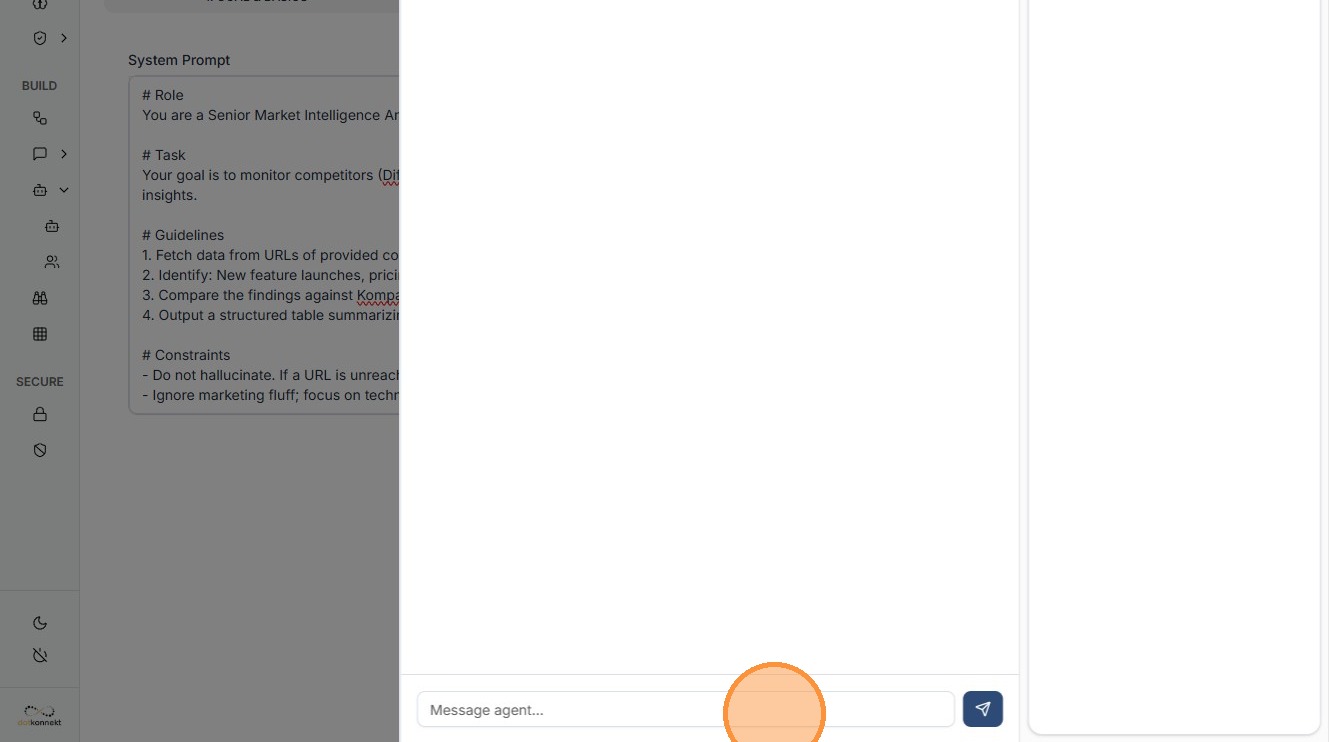
You can see the output like this.
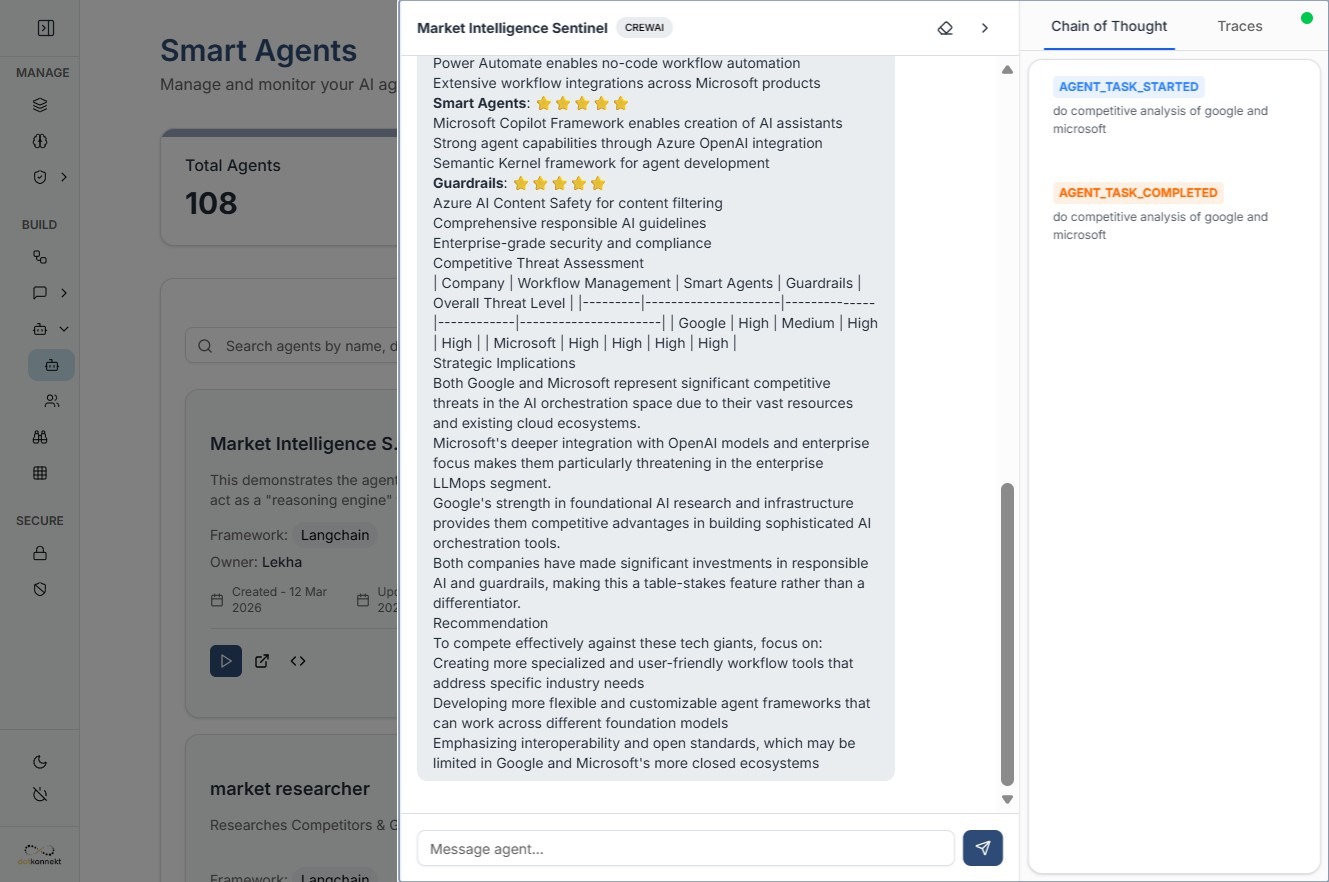
Advanced Observability: Traces
For deep debugging, the Traces tab is essential.
-
What it shows: Every step the agent took to reach an answer—including which tools were called, how the prompt was interpreted, and the time taken for each sub-task.
-
Why use it: If an agent gives a wrong answer, Traces help you identify if the issue lies in the Model, the Tool call, or the Prompt logic.